Four years of bike count data: If you build it, they will come (most of the time)
By: Max Hepp-Buchanan, Bike Walk RVA Director
Twice a year, for the past four years, Bike Walk RVA deploys dozens of volunteers onto the streets of Richmond over a three-day period to manually tally the number of people biking and walking at specific locations throughout the city. The purpose of this project is to collect baseline data on a street before a bike lane project is completed so that we know how many people were riding on the street before the bike lane, and to quantify any change in ridership after the bike lane was built. We also want to get a strong sense of where people are and are not biking and walking for transportation. We closely follow the methodology set forth in the National Bicycle and Pedestrian Documentation Project, which is why the counts are conducted Tuesday, Wednesday, and Thursday between the hours of 5:00p.m. and 7:00p.m.
This May, we completed four years of data collection and certain trends are already starting to reveal themselves as the City of Richmond proceeds with the build-out of the Bicycle Master Plan. In this post, we’ll look at three different bicycle infrastructure projects that have been completed in recent years and how bicycle traffic has increased (or not) along those corridors.
If you don’t feel like looking at maps and charts below, here is the takeaway: if you build it, they will come (most of the time).
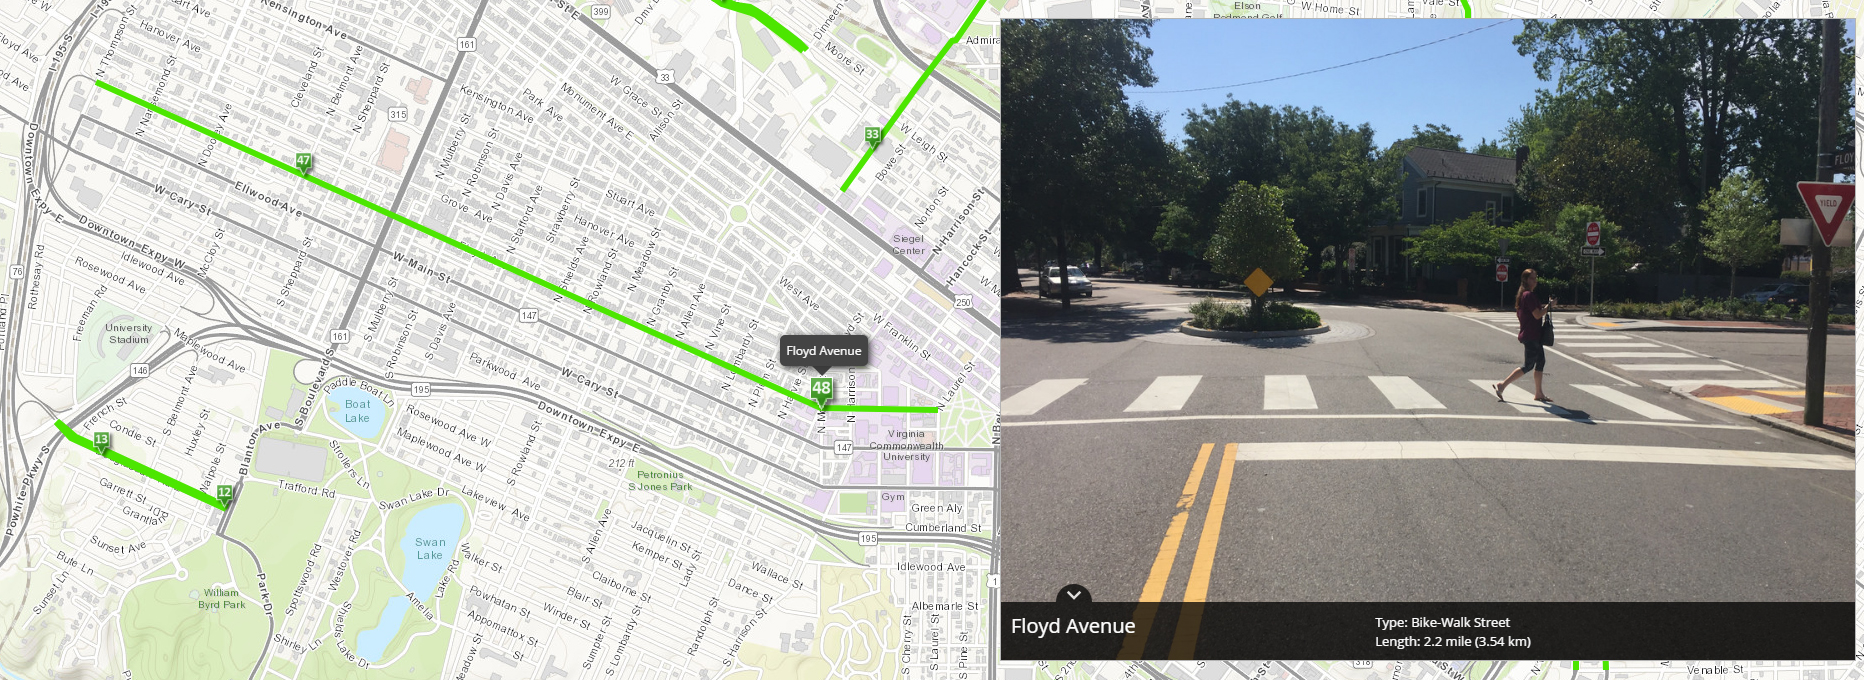
Let’s start with the highest-profile on-street bikeway project completed to date: the Floyd Avenue “Bike-Walk Street” (aka “Bike Boulevard”, aka “Bike-Walk Boulevard”, aka “that street with all the traffic circles”). Due to the length of the street (2.25 miles) and the different character of the neighborhoods, we conducted counts at two different locations: one in the Fan between Allen and Granby, and one in the Museum District between Belmont and Auburn.
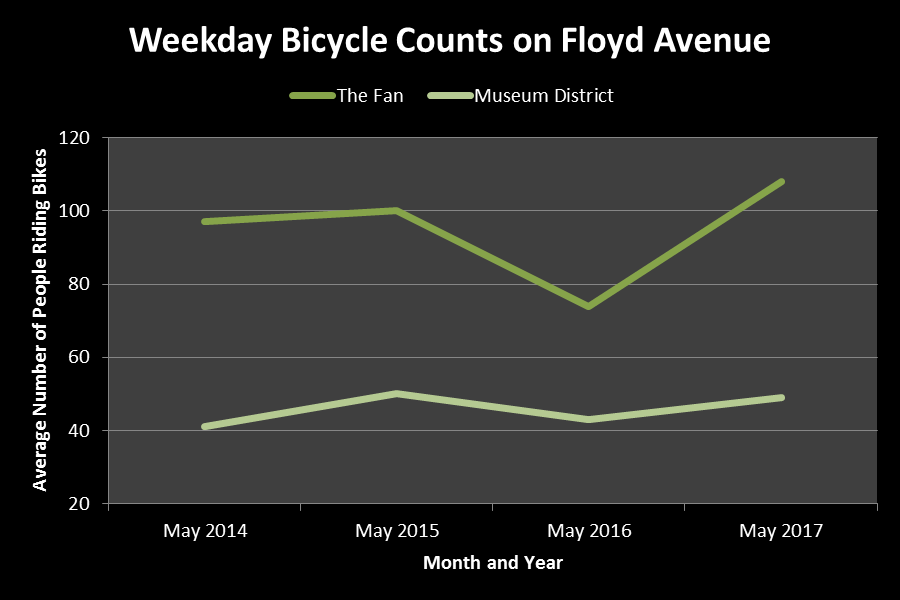
In the Fan, average weekday bike traffic during rush hour averaged at 97 (that’s an average of 97 people riding by that point between the hours of 5:00p.m. and 7:00p.m., Tuesday through Thursday) in May 2014. This is before any construction started on the project, but design and public meetings were underway. May 2015 brought a slight increase, while May 2016 brought a sharp decrease.*
*It is important to note that for all locations discussed in this post, May 2016 was a very rainy month and the counts were conducted during poor weather days – you will see drops across the board during this month due to lower numbers of people willing to ride in the rain. Also, Floyd Avenue was still under construction in May 2016 (construction began in November 2015).
However, May 2017 has shown an increase in bicycle traffic on Floyd Avenue in the Fan: up 11 percent from 2014, up eight percent from 2015, and up 46 percent from 2016. Though there are less overall trips taken on Floyd Avenue in the Museum District, the counts show a similar trend in fluctuation: up 20 percent from 2014, no significant change from 2015, and up 14 percent from 2016.
The upshot for the Floyd Avenue: bicycle traffic has increased since the construction of the traffic-calming and bicycle-friendly additions that make it a bike/walk street.
Next up: the buffered bike lane on W. Leigh Street, which was striped in August 2015 and runs about 0.7 miles from Myers Street to Dinneen Street near the Bon Secours Washington Redskins Training Center.

Since May 2014, there has been a 50 percent increase in bicycle traffic during the count periods, with the expected dip in May of 2016 due to bad weather conditions. There has been a clear increase in bicycle traffic on W. Leigh Street since the buffered bike lane was striped two years ago.

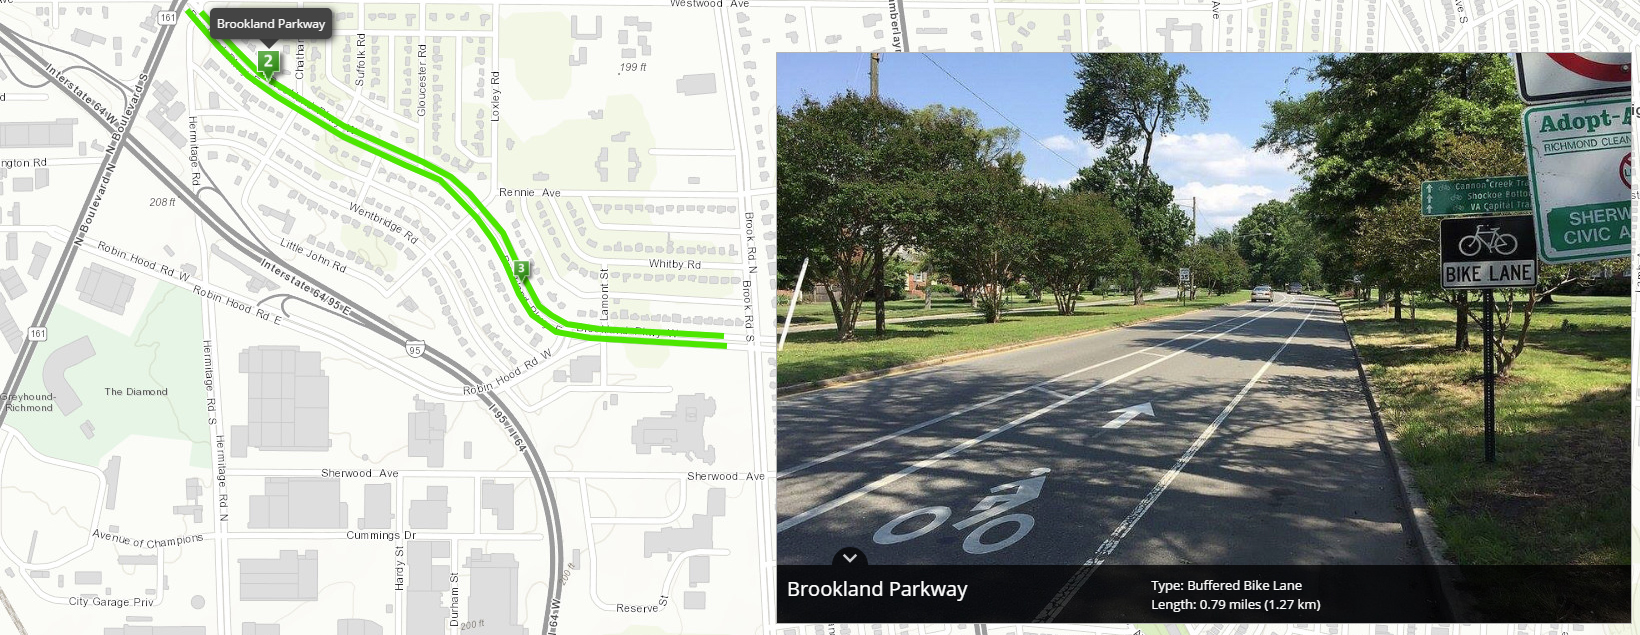
Finally, let’s look at the buffered bike lanes on Brookland Parkway in the Northside, running 0.8 miles from the Boulevard to Brook Road in a curvilinear manner. The project was one of the first “road diets” done in the past four years in the city and was striped in October 2014.
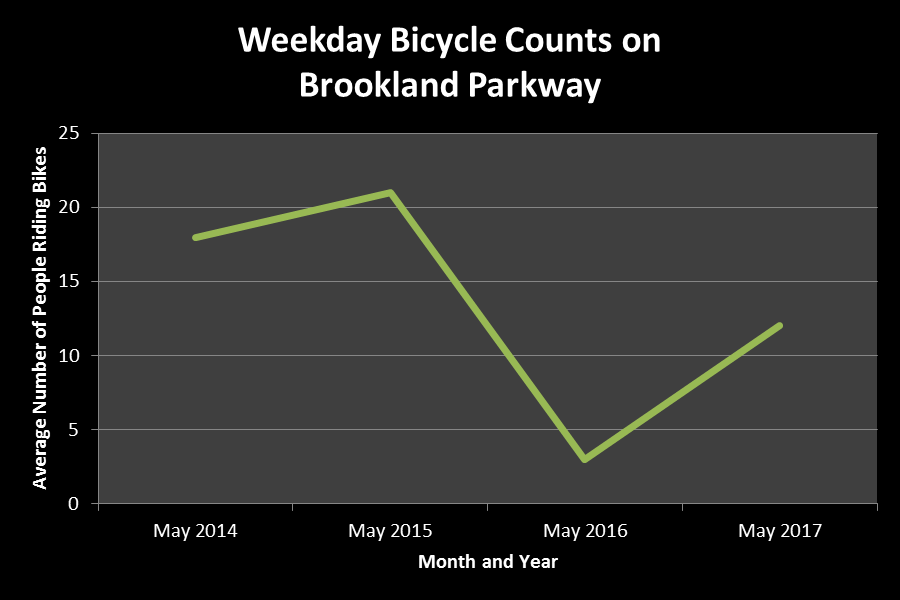
This is one of the few bike lanes we have studied that has not demonstrated marked growth in ridership. There was a slight uptick between May 2014 and May 2015, when the project was first striped. Then there was the predictable dip in May 2016 due to poor weather, and May 2017 has not shown a bounce back. We don’t know why this is exactly, but some possibilities are that it is not a direct route between the Boulevard and Brook Road (Westwood Avenue is a more direct route for people who live in Northside), it does not run along any major destinations, and it is not yet part of a connected Northside bike network. But as more bike lane projects are constructed through the Northside area (Brook Road is on deck), integrating Brookland Parkway into a larger network, we may see this change yet.
Big picture, this documentation project is just beginning. We still have a relatively small number of bike lanes on the ground in Richmond, though there are 25+ miles in design right now between about 10 different projects. We are already collecting baseline data on many of those locations, and are anxious to see how things change over time with the growth of a connected city-wide bike network.
###
[We always need volunteers to help with this count project. We are currently up to 30 locations across the city, and with three days per count period and two count periods per year, that’s a total of 180 volunteer positions we need filled each year to make this project work. If you are interested in volunteering, please email [email protected] for more information.]
2 thoughts on “Four years of bike count data: If you build it, they will come (most of the time)”